
Redesigning Performance Tracking for a Global Sales Team
Redesigning Performance Tracking for a Global Sales Team
Empowering the sales team of a global travel club with a redesigned dashboard to track performance, identify opportunities, and drive growth through data.
Empowering the sales team of a global travel club with a redesigned dashboard to track performance, identify opportunities, and drive growth through data.
Project overview
Project overview
An exclusive, invitation-only travel club relies on a global sales force to refer and activate new members. To support growth, the company aimed to improve their internal dashboard for monitoring sales performance.
We redesigned the existing module, originally called the “Info Center", to offer a more intuitive and powerful experience for tracking key metrics, team progress, and individual performance. The new design enhances visibility, reduces friction, and helps drive engagement and growth.
🙋🏼♀️ My role
🙋🏼♀️ My role
As the UX Designer in a two-person team, I was responsible for:
As the UX Designer in a two-person team, I was responsible for:
Conducting discovery sessions to understand user needs and business goals
Auditing the current product and user experience to identify improvement areas
Support project planning, based on identified user needs and goals
Mapping key user flows
Creating and refining wireframes based on feedback
Participanting in the UI and responsive design creation
I collaborated closely with a UI Designer, especially during the final stages of the design process.
I collaborated closely with a UI Designer, especially during the final stages of the design process.
The design process
The design process
🔍
Understand
Understand
Conducted workshops and interviews with the client and internal stakeholders.
Conducted workshops and interviews with the client and internal stakeholders.
📌
Analyze and define
Analyze and define
Conducted an audit to identify pain points and improvement opportunities to enhance usability, and defined clear goals for the redesign, focusing on performance tracking.
Conducted an audit to identify pain points and improvement opportunities to enhance usability, and defined clear goals for the redesign, focusing on performance tracking.
✏️
Ideate
Ideate
Created user flows, designed wireframes and iterated based on client feedback before handing off to UI.
Created user flows, designed wireframes and iterated based on client feedback before handing off to UI.
🎨
Propose
Propose
Created UI designs and corresponding responsive designs.
Created UI designs and corresponding responsive designs.
Understanding the challenge
Understanding the challenge
We conducted discovery sessions with the client to gain insight into both user and business goals, uncovering key issues that shaped the vision for the redesign:
We conducted discovery sessions with the client to gain insight into both user and business goals, uncovering key issues that shaped the vision for the redesign:
No easy access to historical data made it difficult to track long-term progress or spot performance trends
Limited visibility into team performance made it hard to identify top performers or those needing support
Performance data spread across multiple pages made tracking efforts time-consuming and the experience feel fragmented
🚀️ Project Goals
🚀️ Project Goals
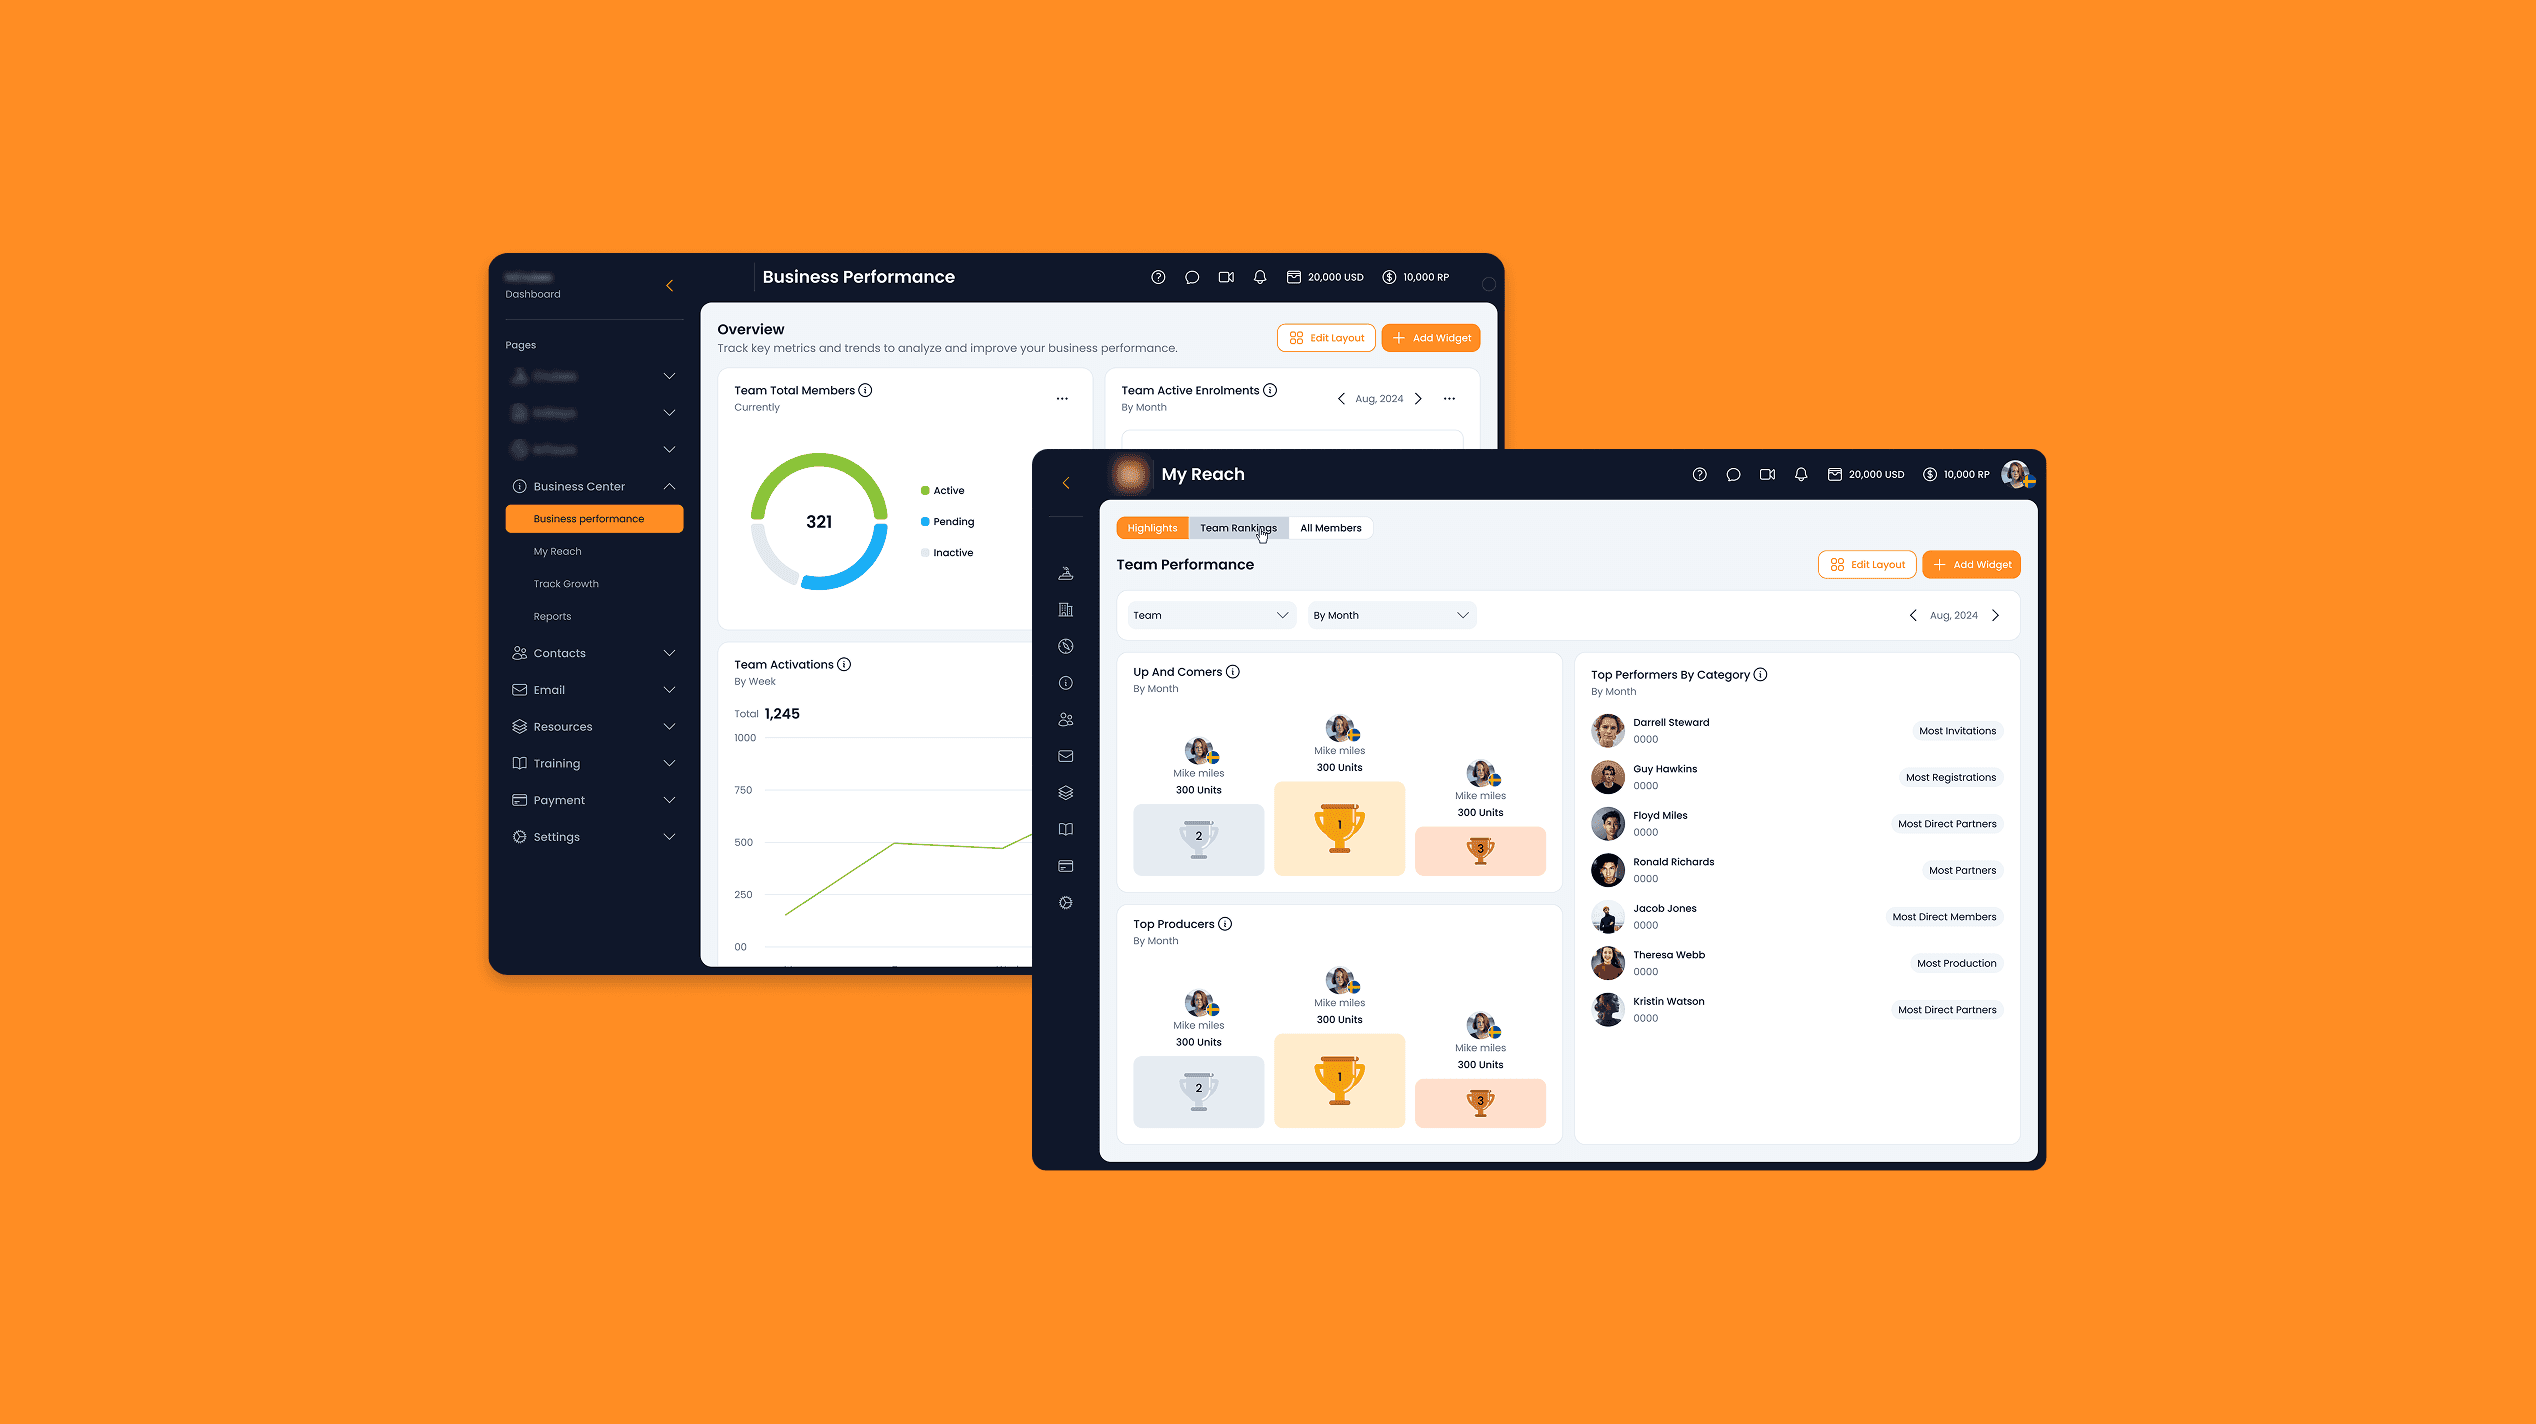
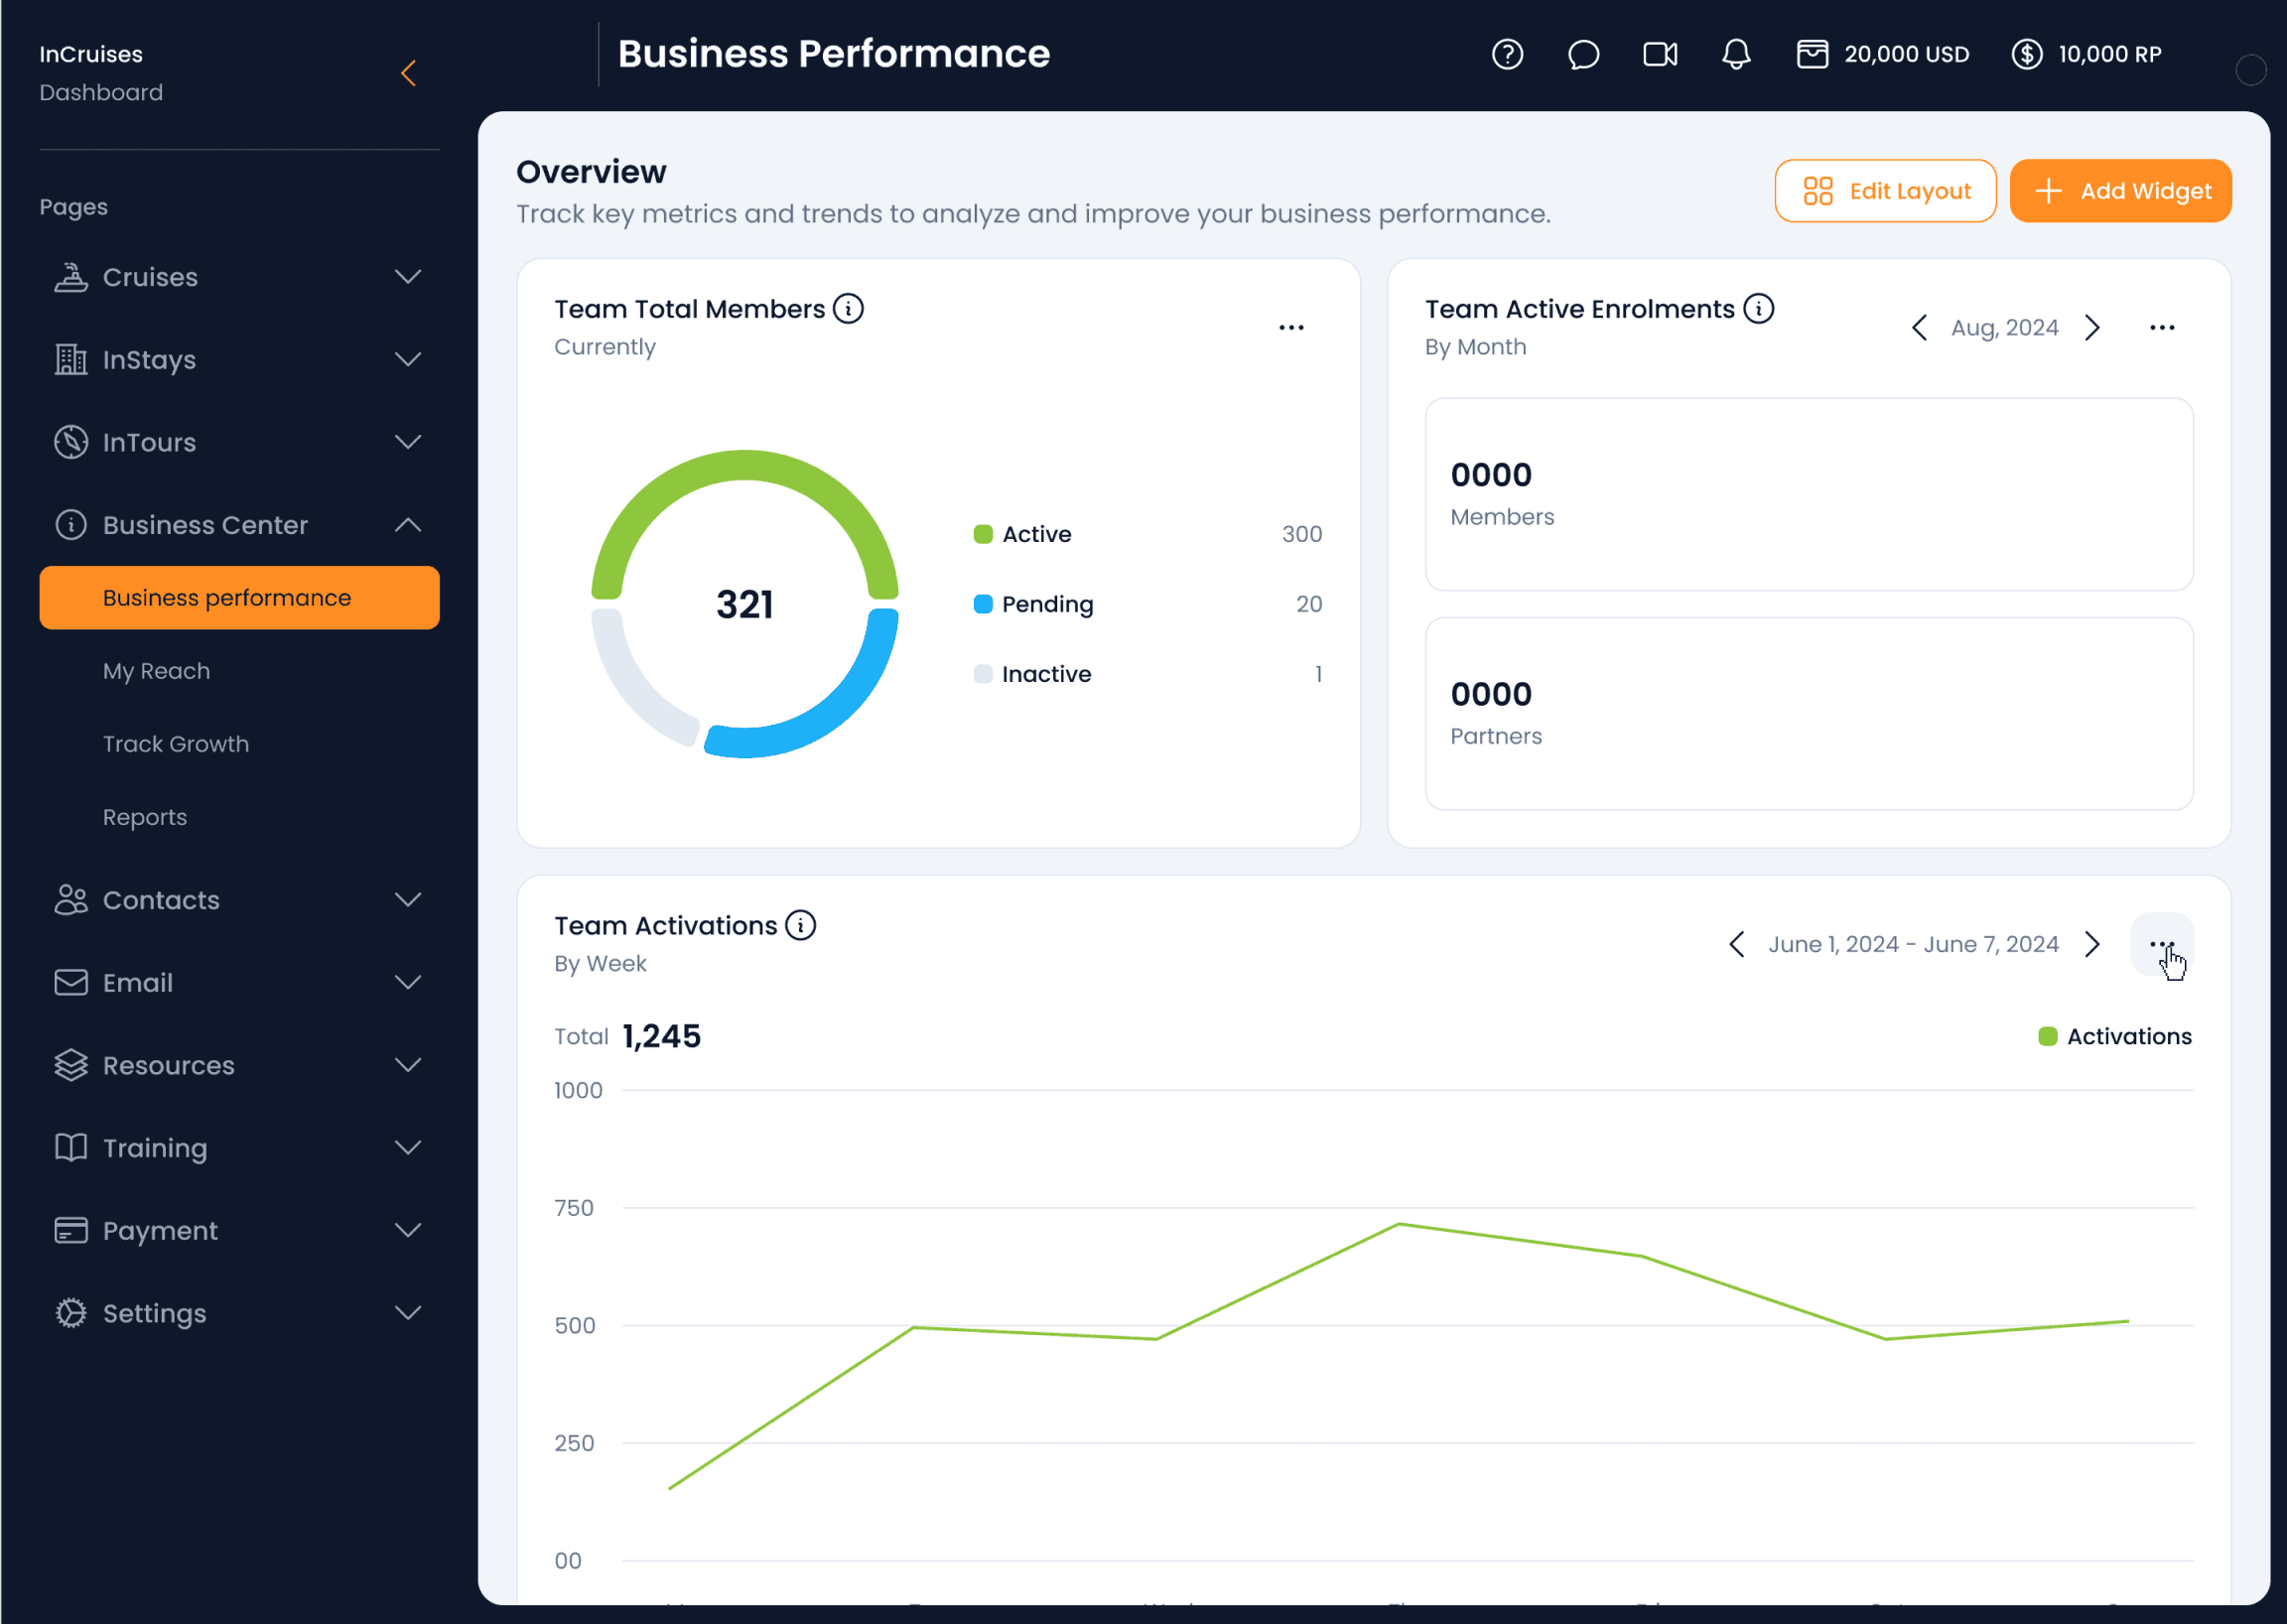
Business Performance Dashboard
Business Performance Dashboard
Allow the sales team members to track individual and team performance trends, key metrics, and insights.
Allow the sales team members to track individual and team performance trends, key metrics, and insights.
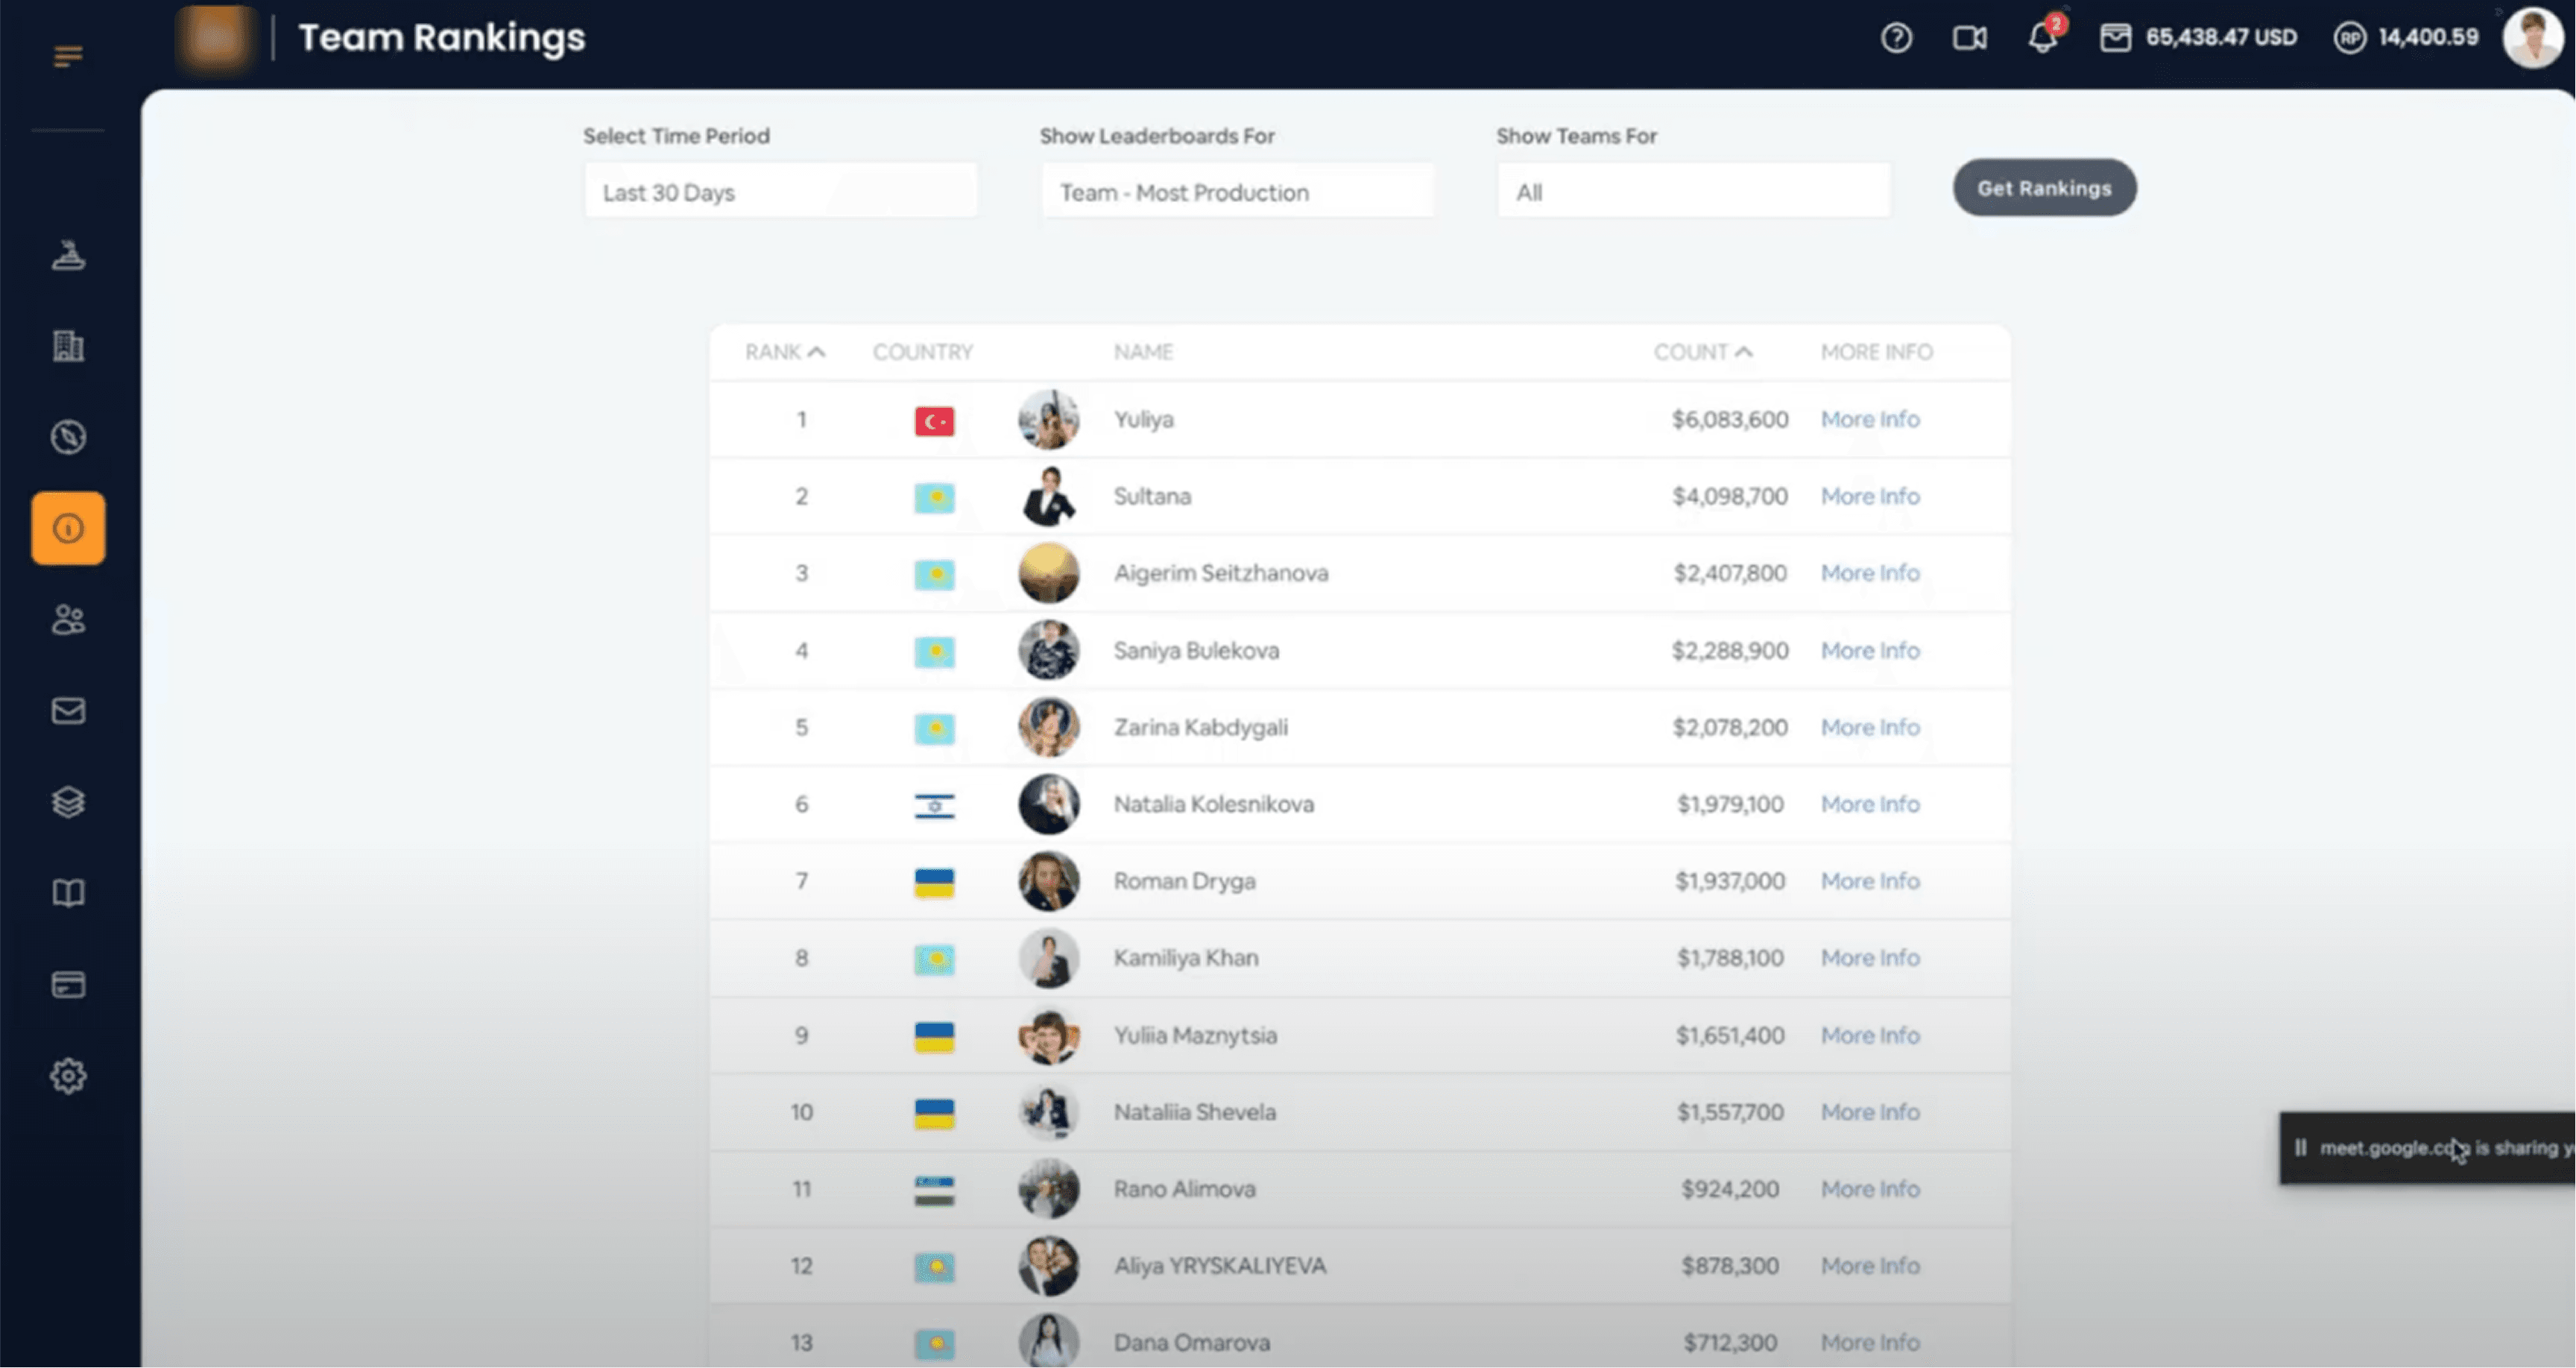
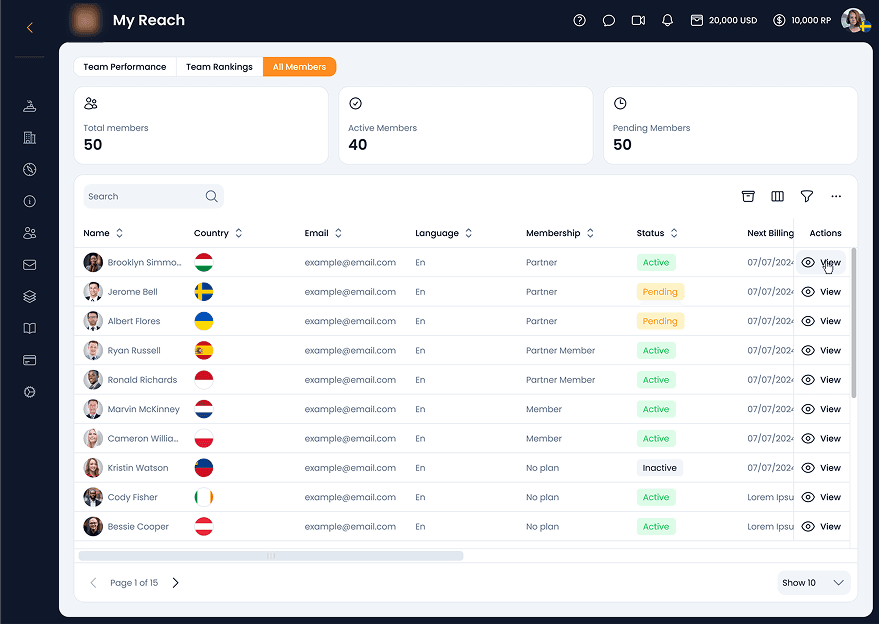
Team Performance Overview
Team Performance Overview
Provide key indicators for the sales team to assess team activity, top performers, and engagement levels.
Provide key indicators for the sales team to assess team activity, top performers, and engagement levels.
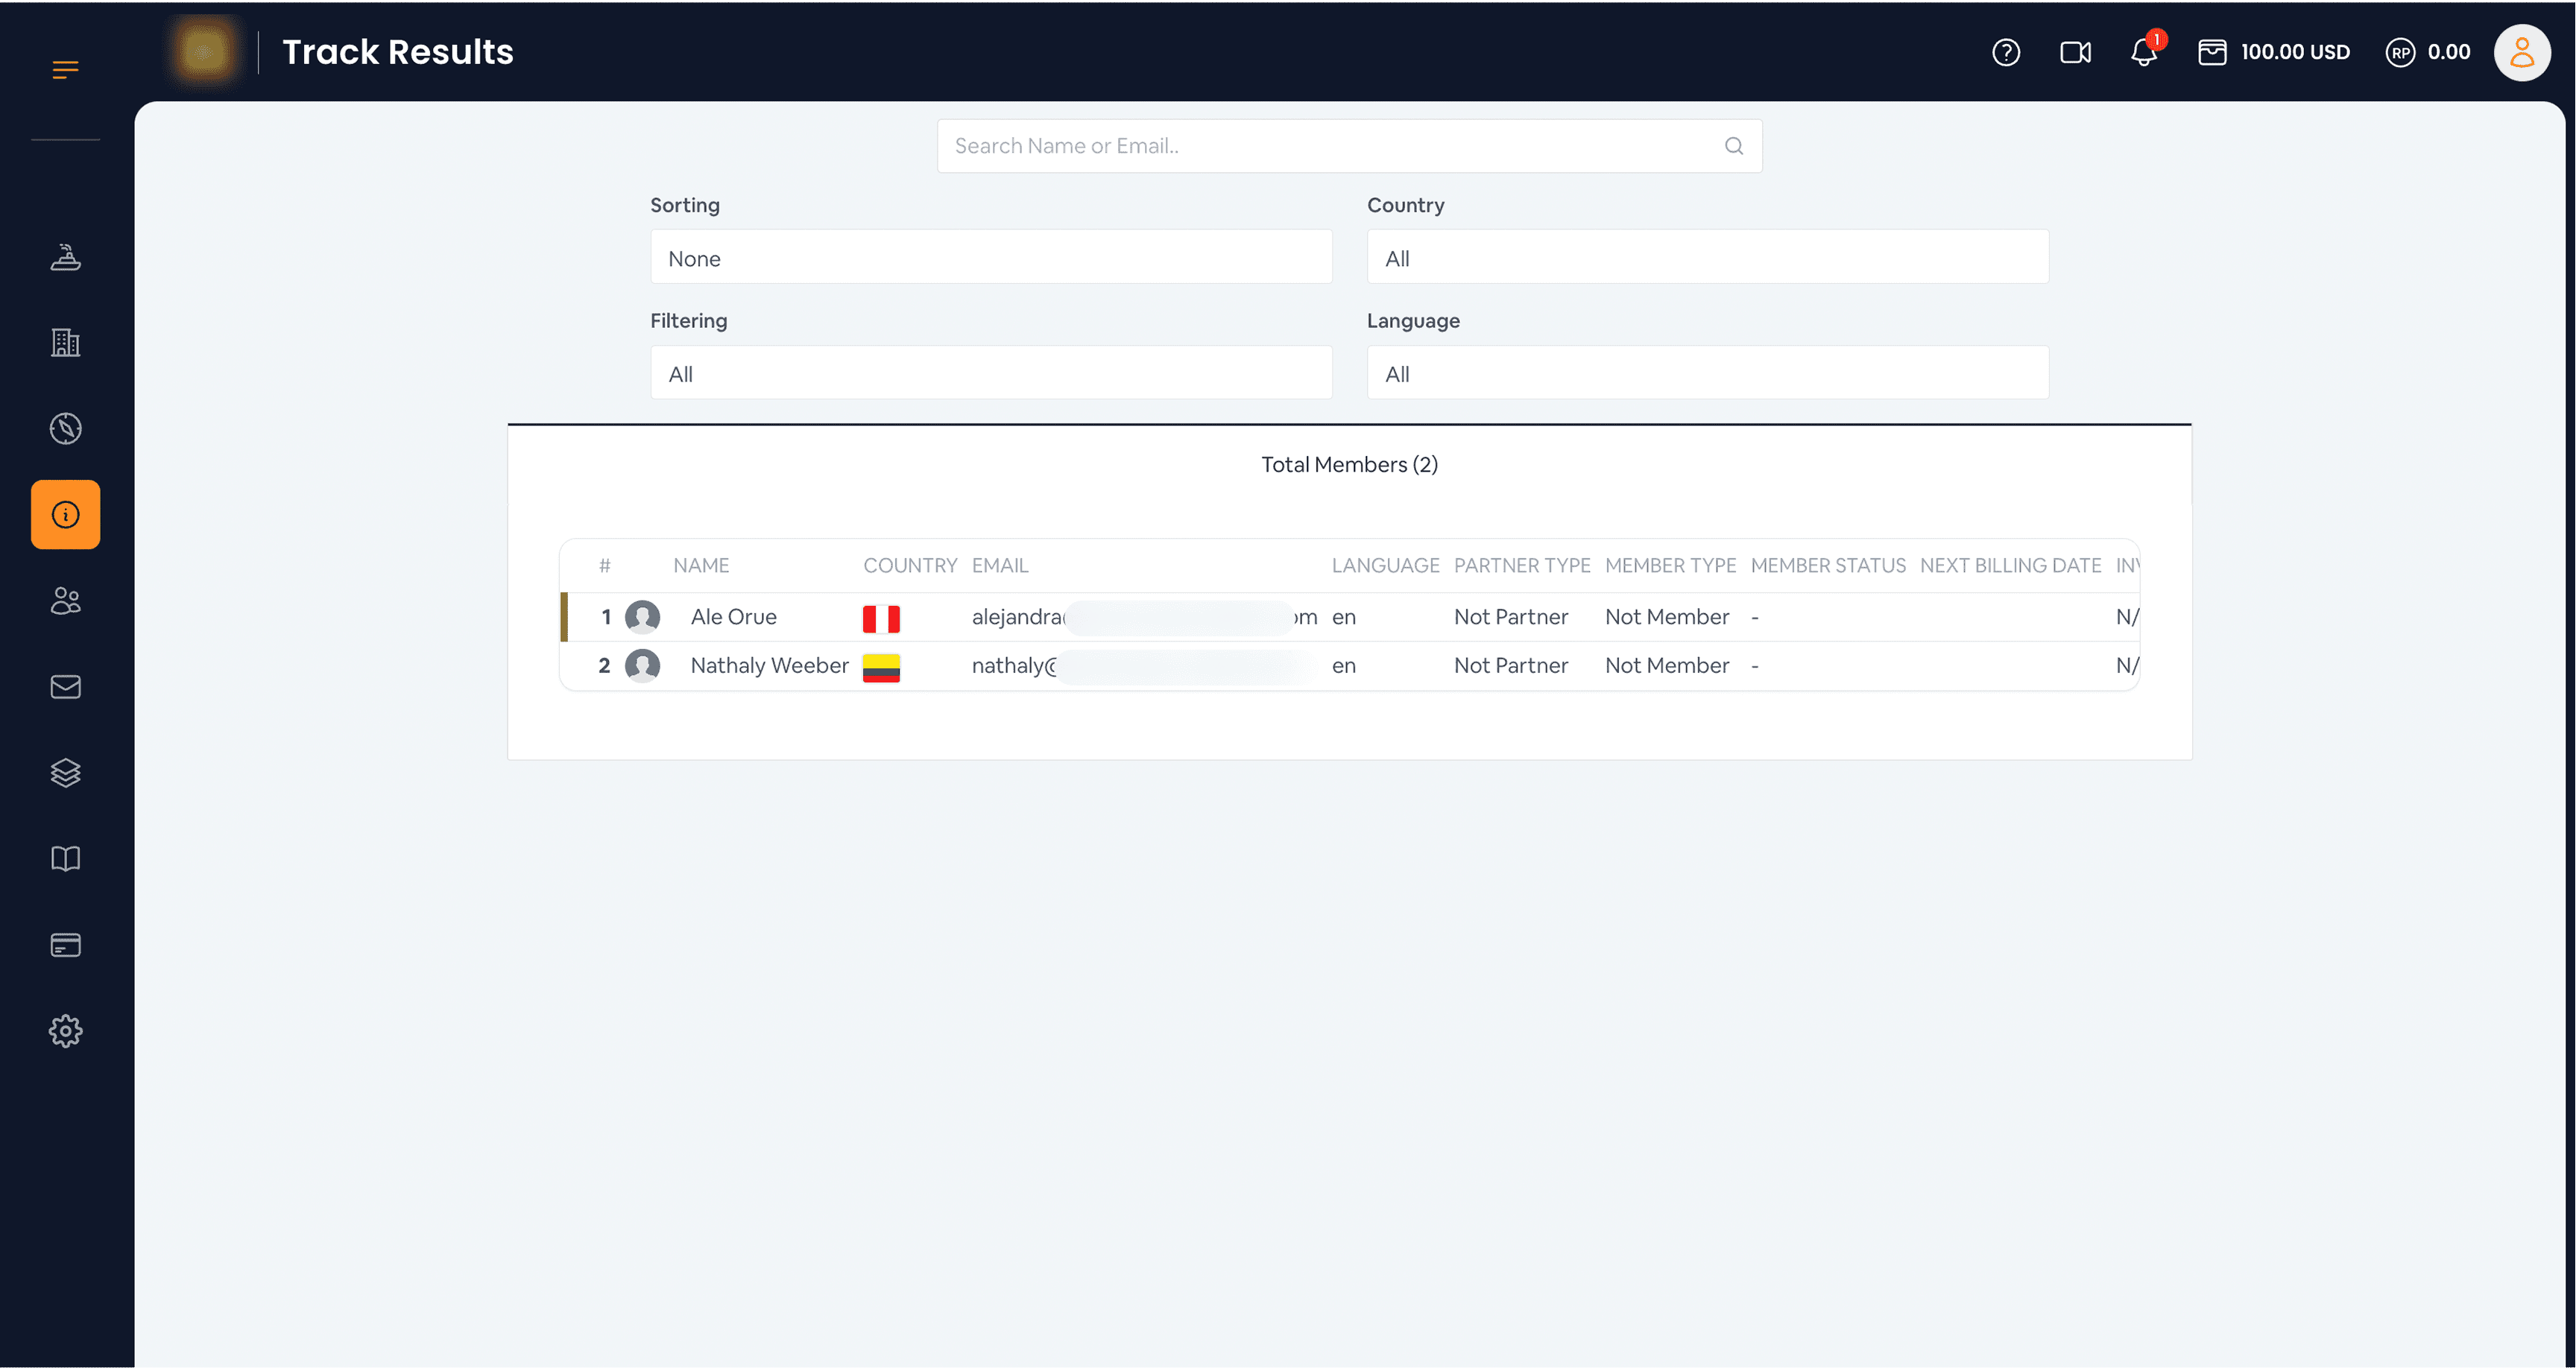
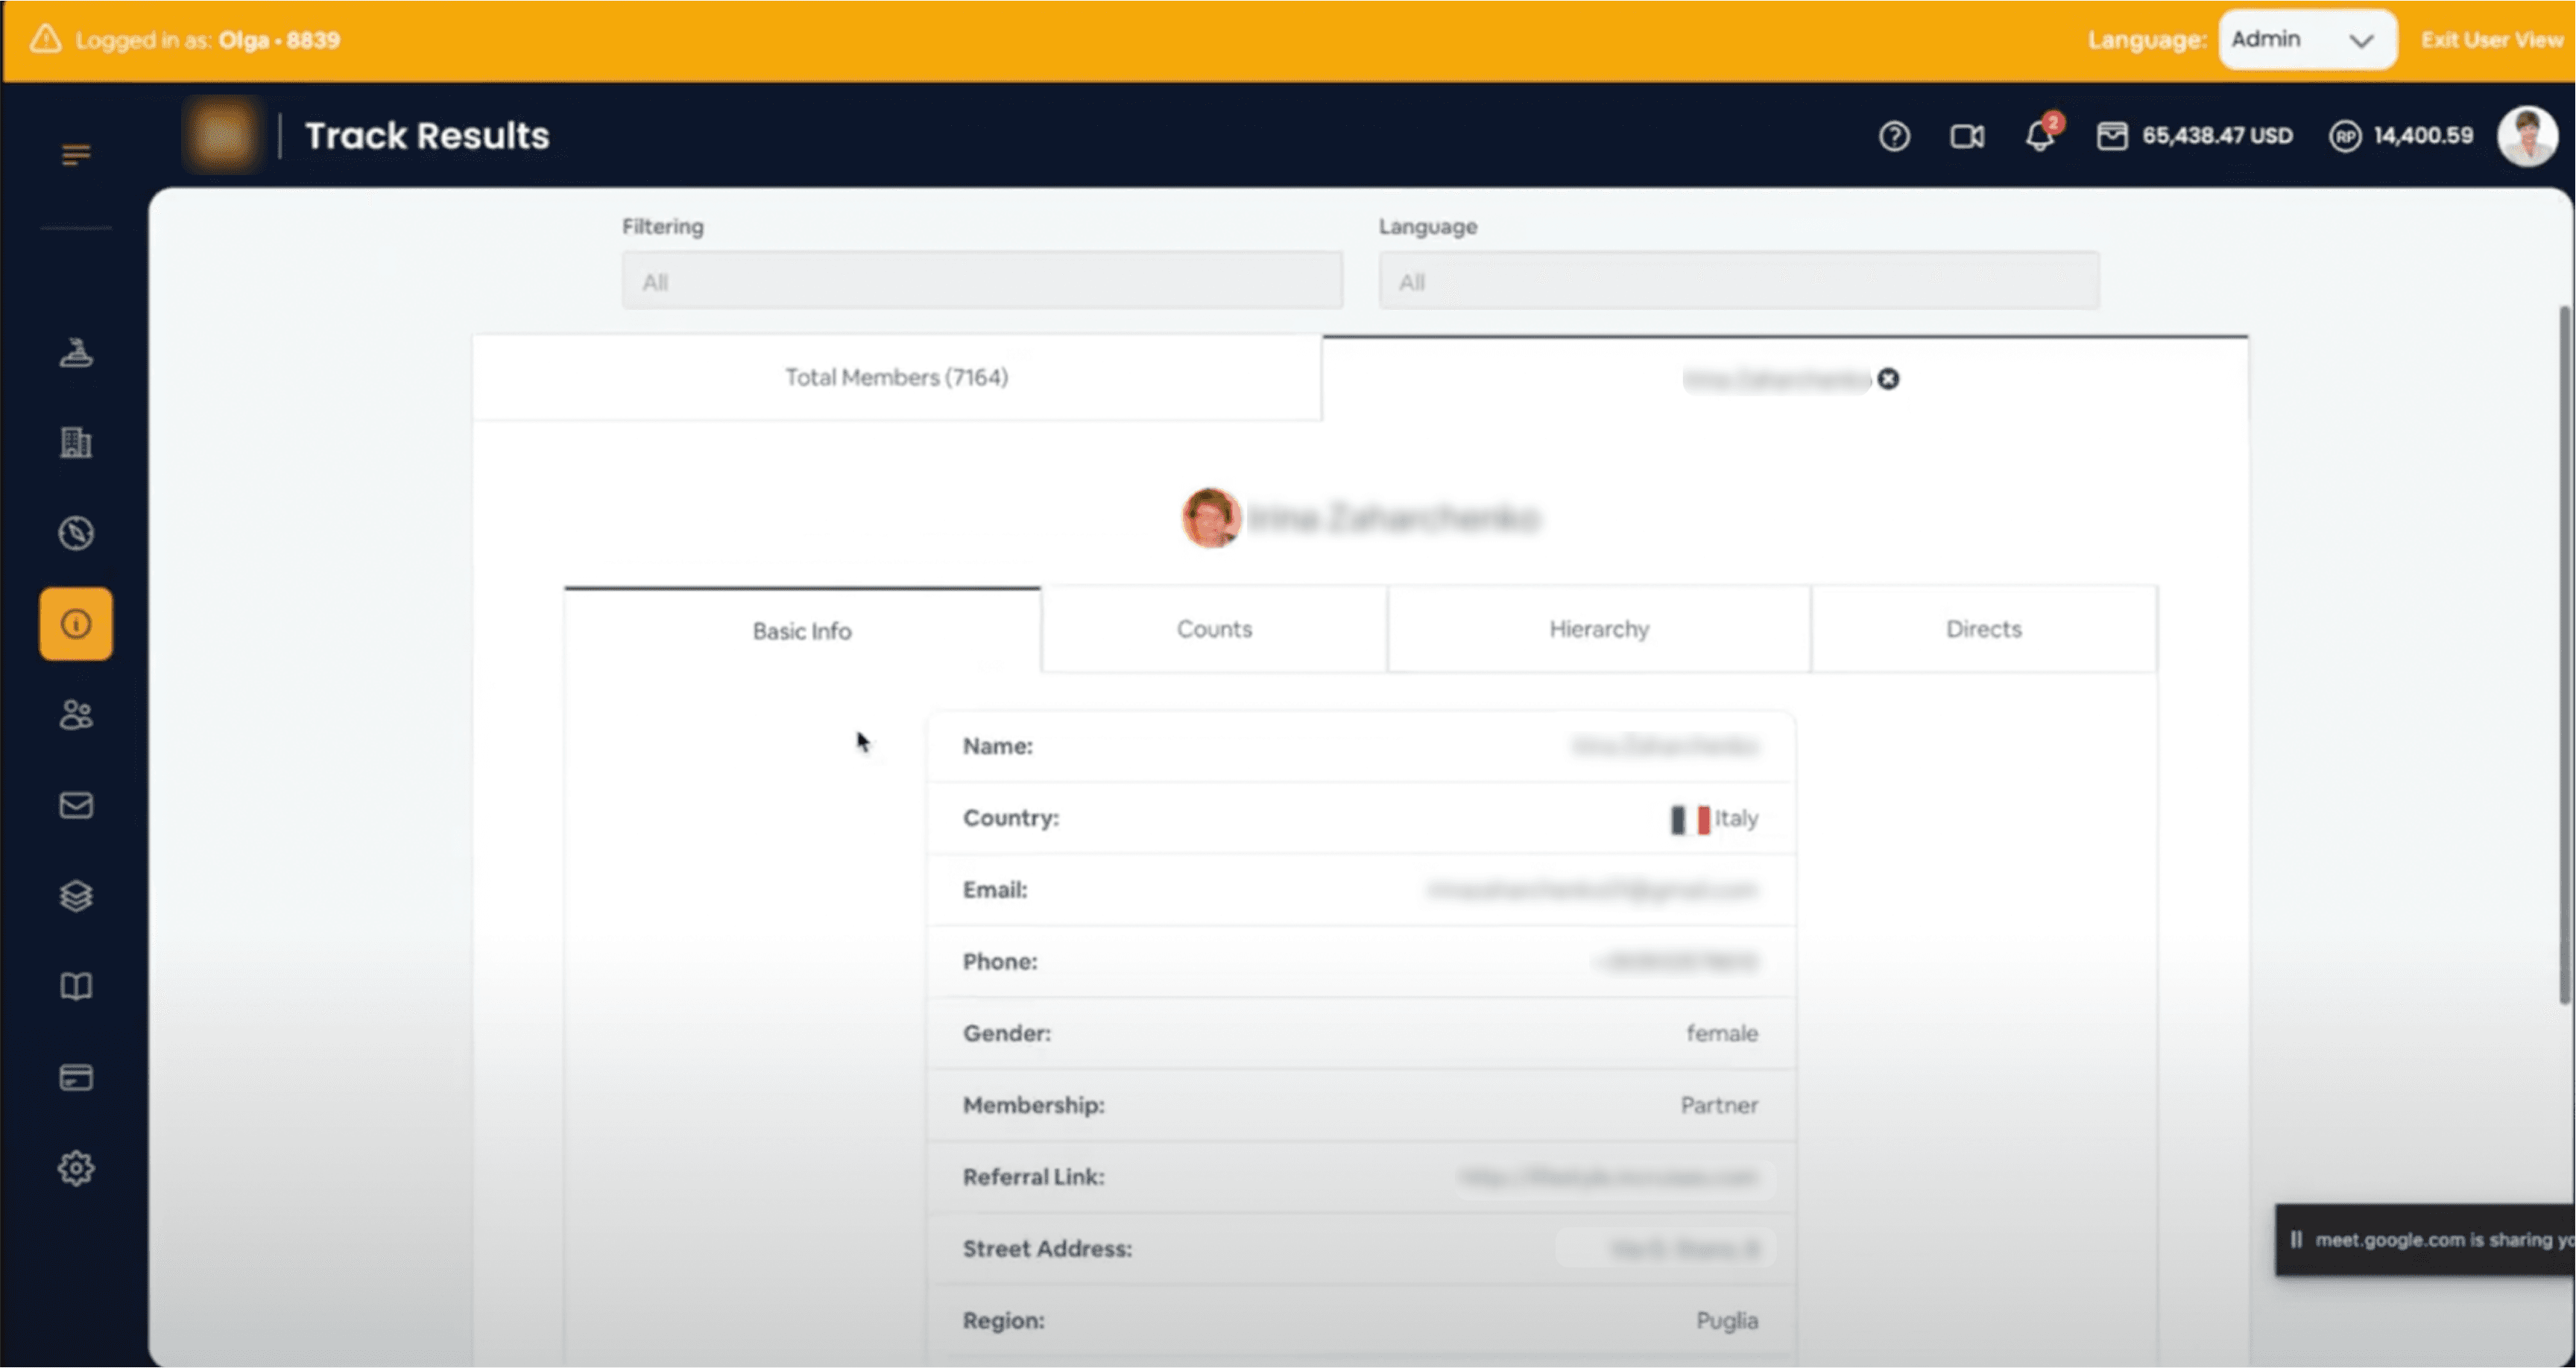
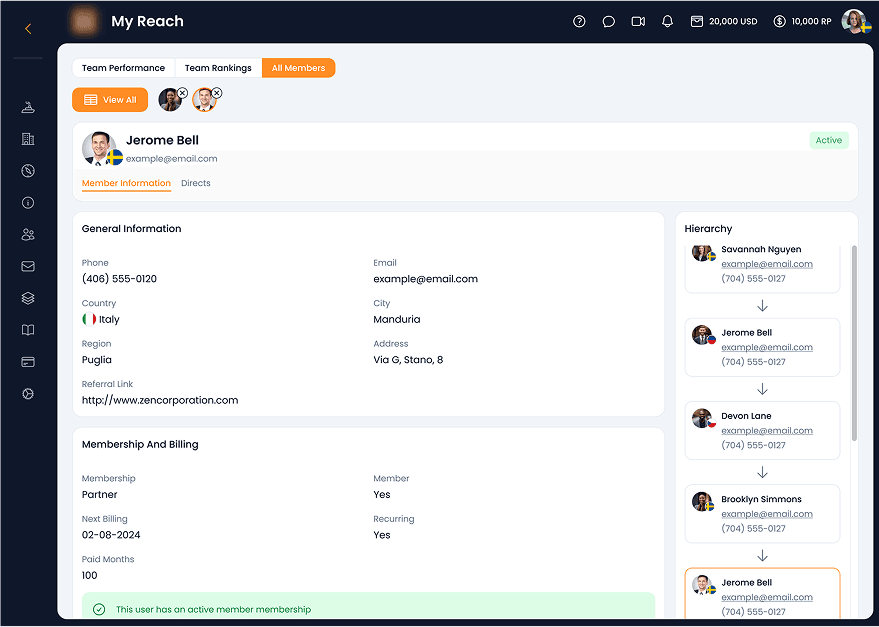
Team Member Insights
Team Member Insights
Enable partners to search, filter, and analyze individual team members, including hierarchy, location, and contributions.
Enable partners to search, filter, and analyze individual team members, including hierarchy, location, and contributions.
UXUI Audit
UXUI Audit
I audited the existing module to ensure continuity and identify areas for improvement. Key findings included:
I audited the existing module to ensure continuity and identify areas for improvement. Key findings included:
Repeated content across multiple pages made navigation inefficient and increased cognitive load
Different layouts and styles led to a fragmented experience
Missing feedback when no data was available caused user uncertainty
Redundant menu options made finding information harder
Unclear labels and missing descriptions made it difficult to locate information and understand its context
Screenshots of the original Info Center module


Project Planning
Project Planning
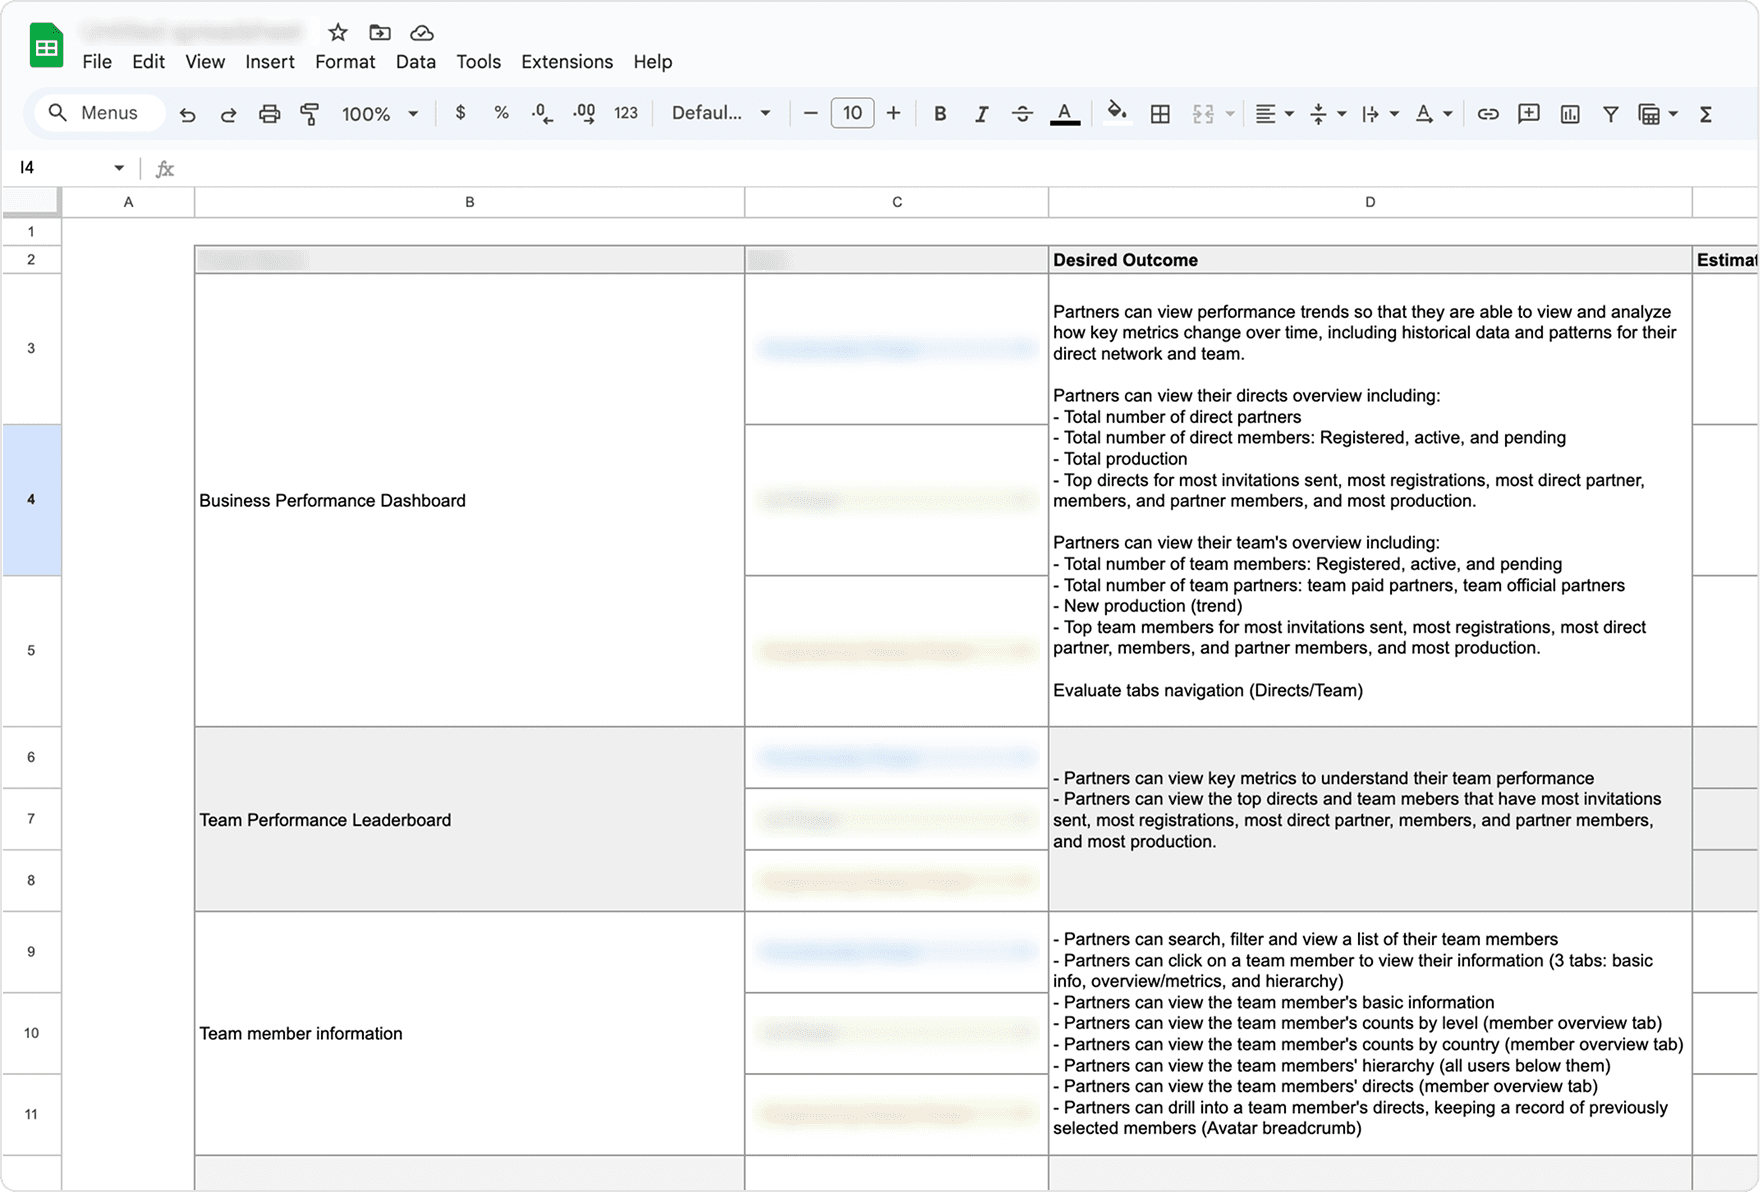
With user and business goals defined, we held a planning session to share discovery findings, align stakeholders on project milestones, and ensure roadmap clarity. This step helped the Project Manager prioritize effectively and provided the client with a clear path forward before moving into wireframing.
With user and business goals defined, we held a planning session to share discovery findings, align stakeholders on project milestones, and ensure roadmap clarity. This step helped the Project Manager prioritize effectively and provided the client with a clear path forward before moving into wireframing.
Planning exercise in Google Sheets outlining key milestones and expected outcomes.
Wireframes
Wireframes
Based on the audit findings, I redesigned the information architecture to simplify navigation and created wireframes to outline initial user flows and screen layouts. Weekly progress was shared with the client for feedback and validation before advancing to UI designs.
Based on the audit findings, I redesigned the information architecture to simplify navigation and created wireframes to outline initial user flows and screen layouts. Weekly progress was shared with the client for feedback and validation before advancing to UI designs.
Proposed information architecture

Figma file structure

Early wireframe iterations outlining user flows and screen layouts.


UI designs
UI designs
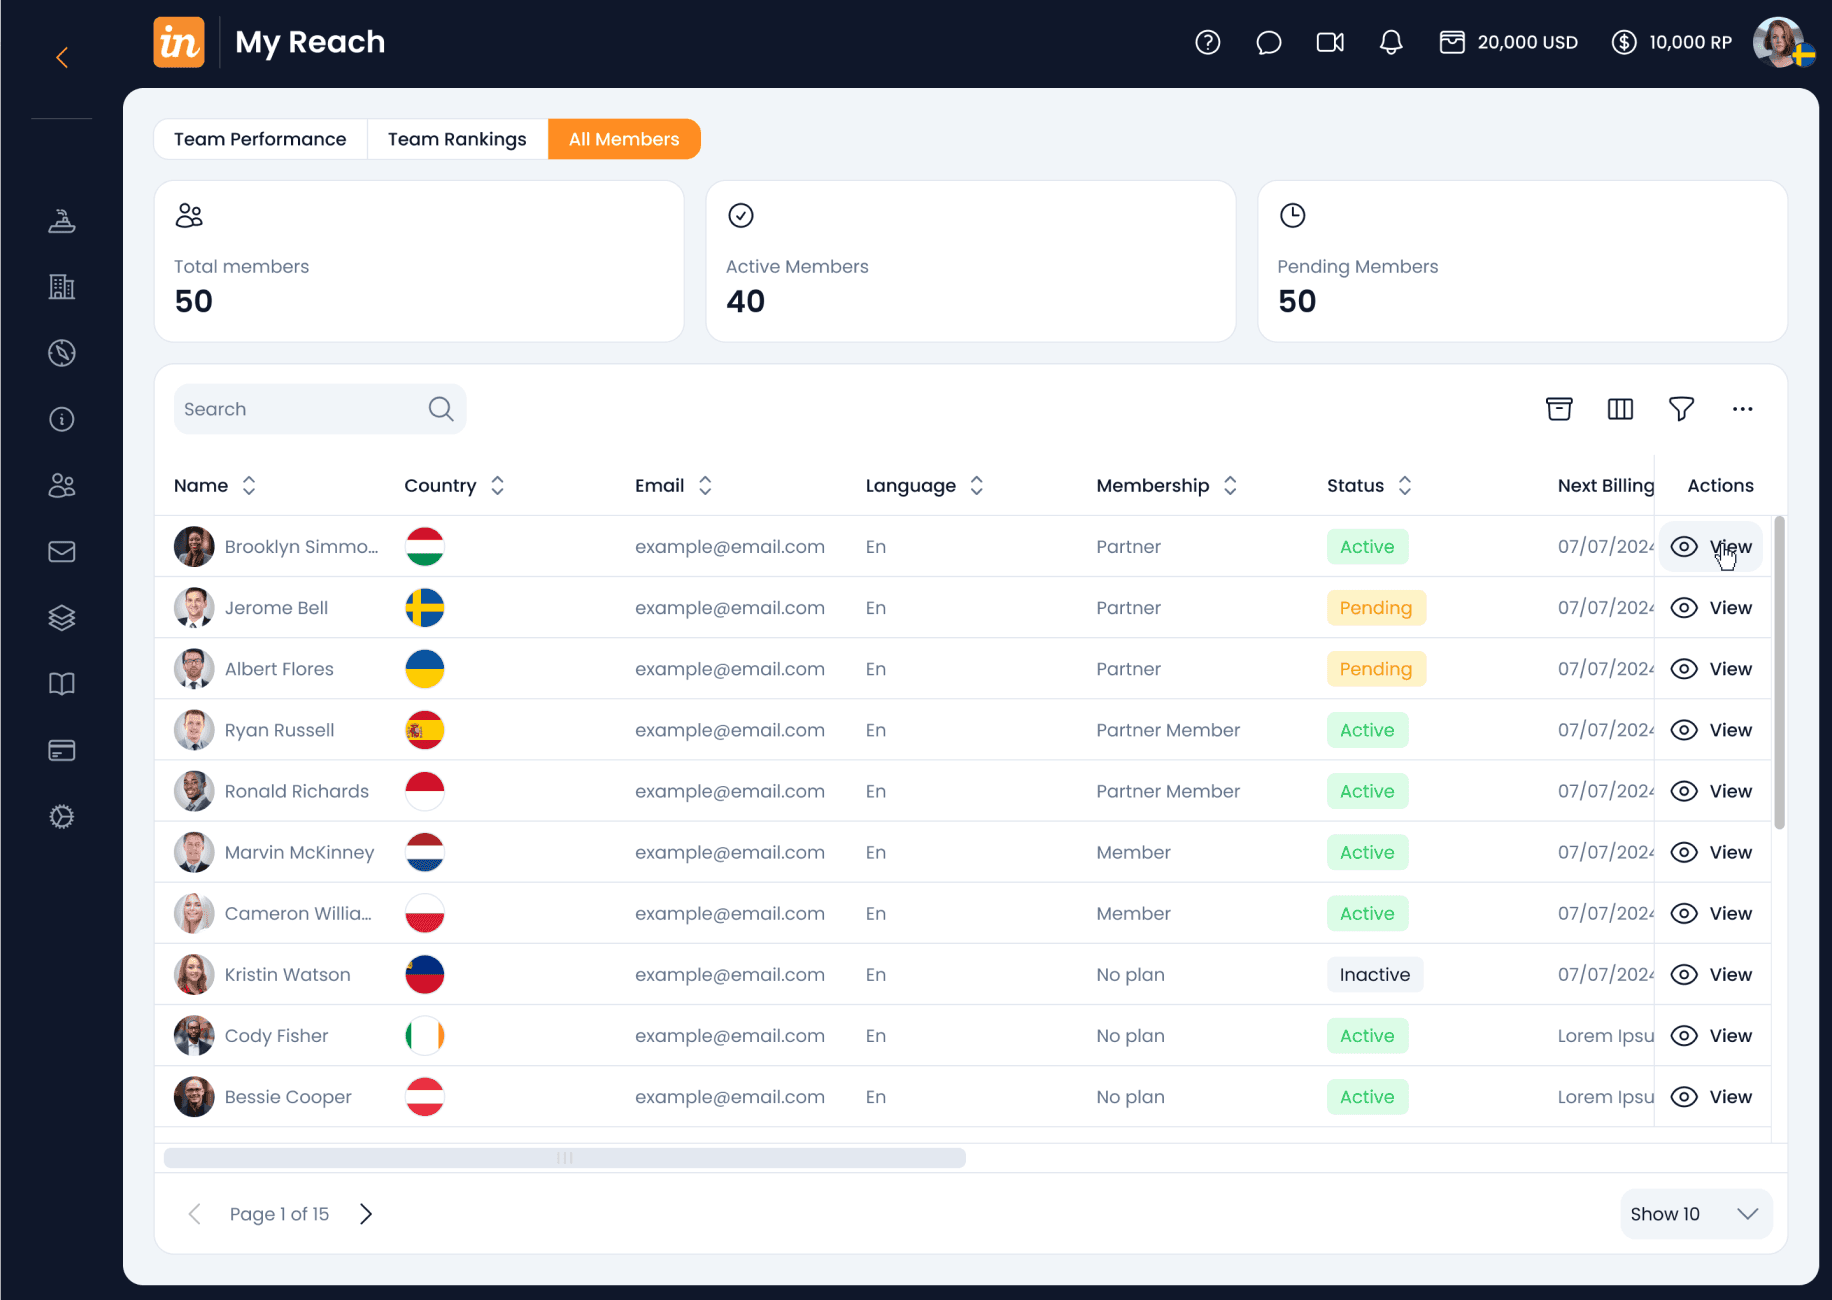
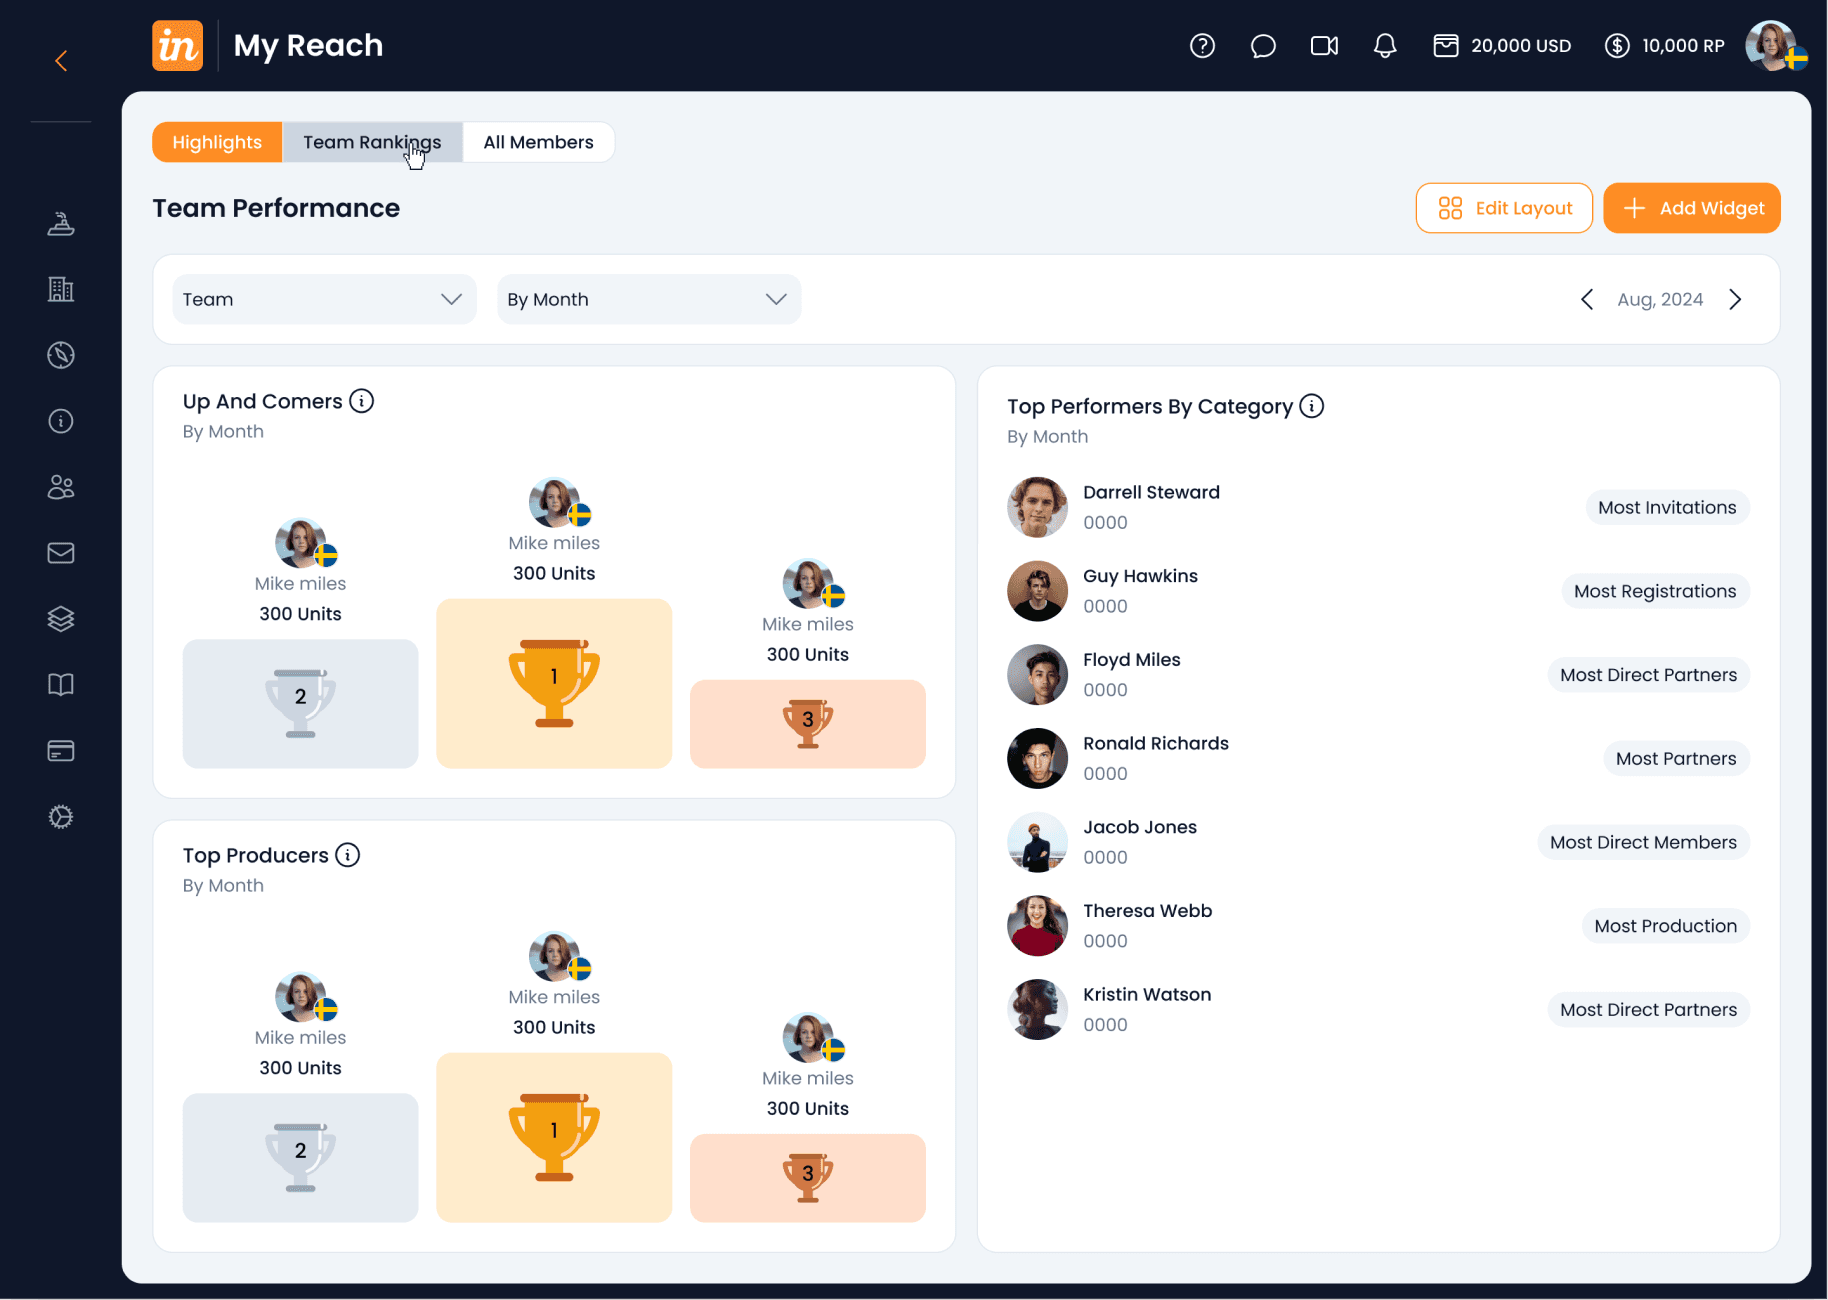
Once wireframes were approved, I supported the UI phase by collaborating on responsive designs, which were handed off for implementation.
Once wireframes were approved, I supported the UI phase by collaborating on responsive designs, which were handed off for implementation.
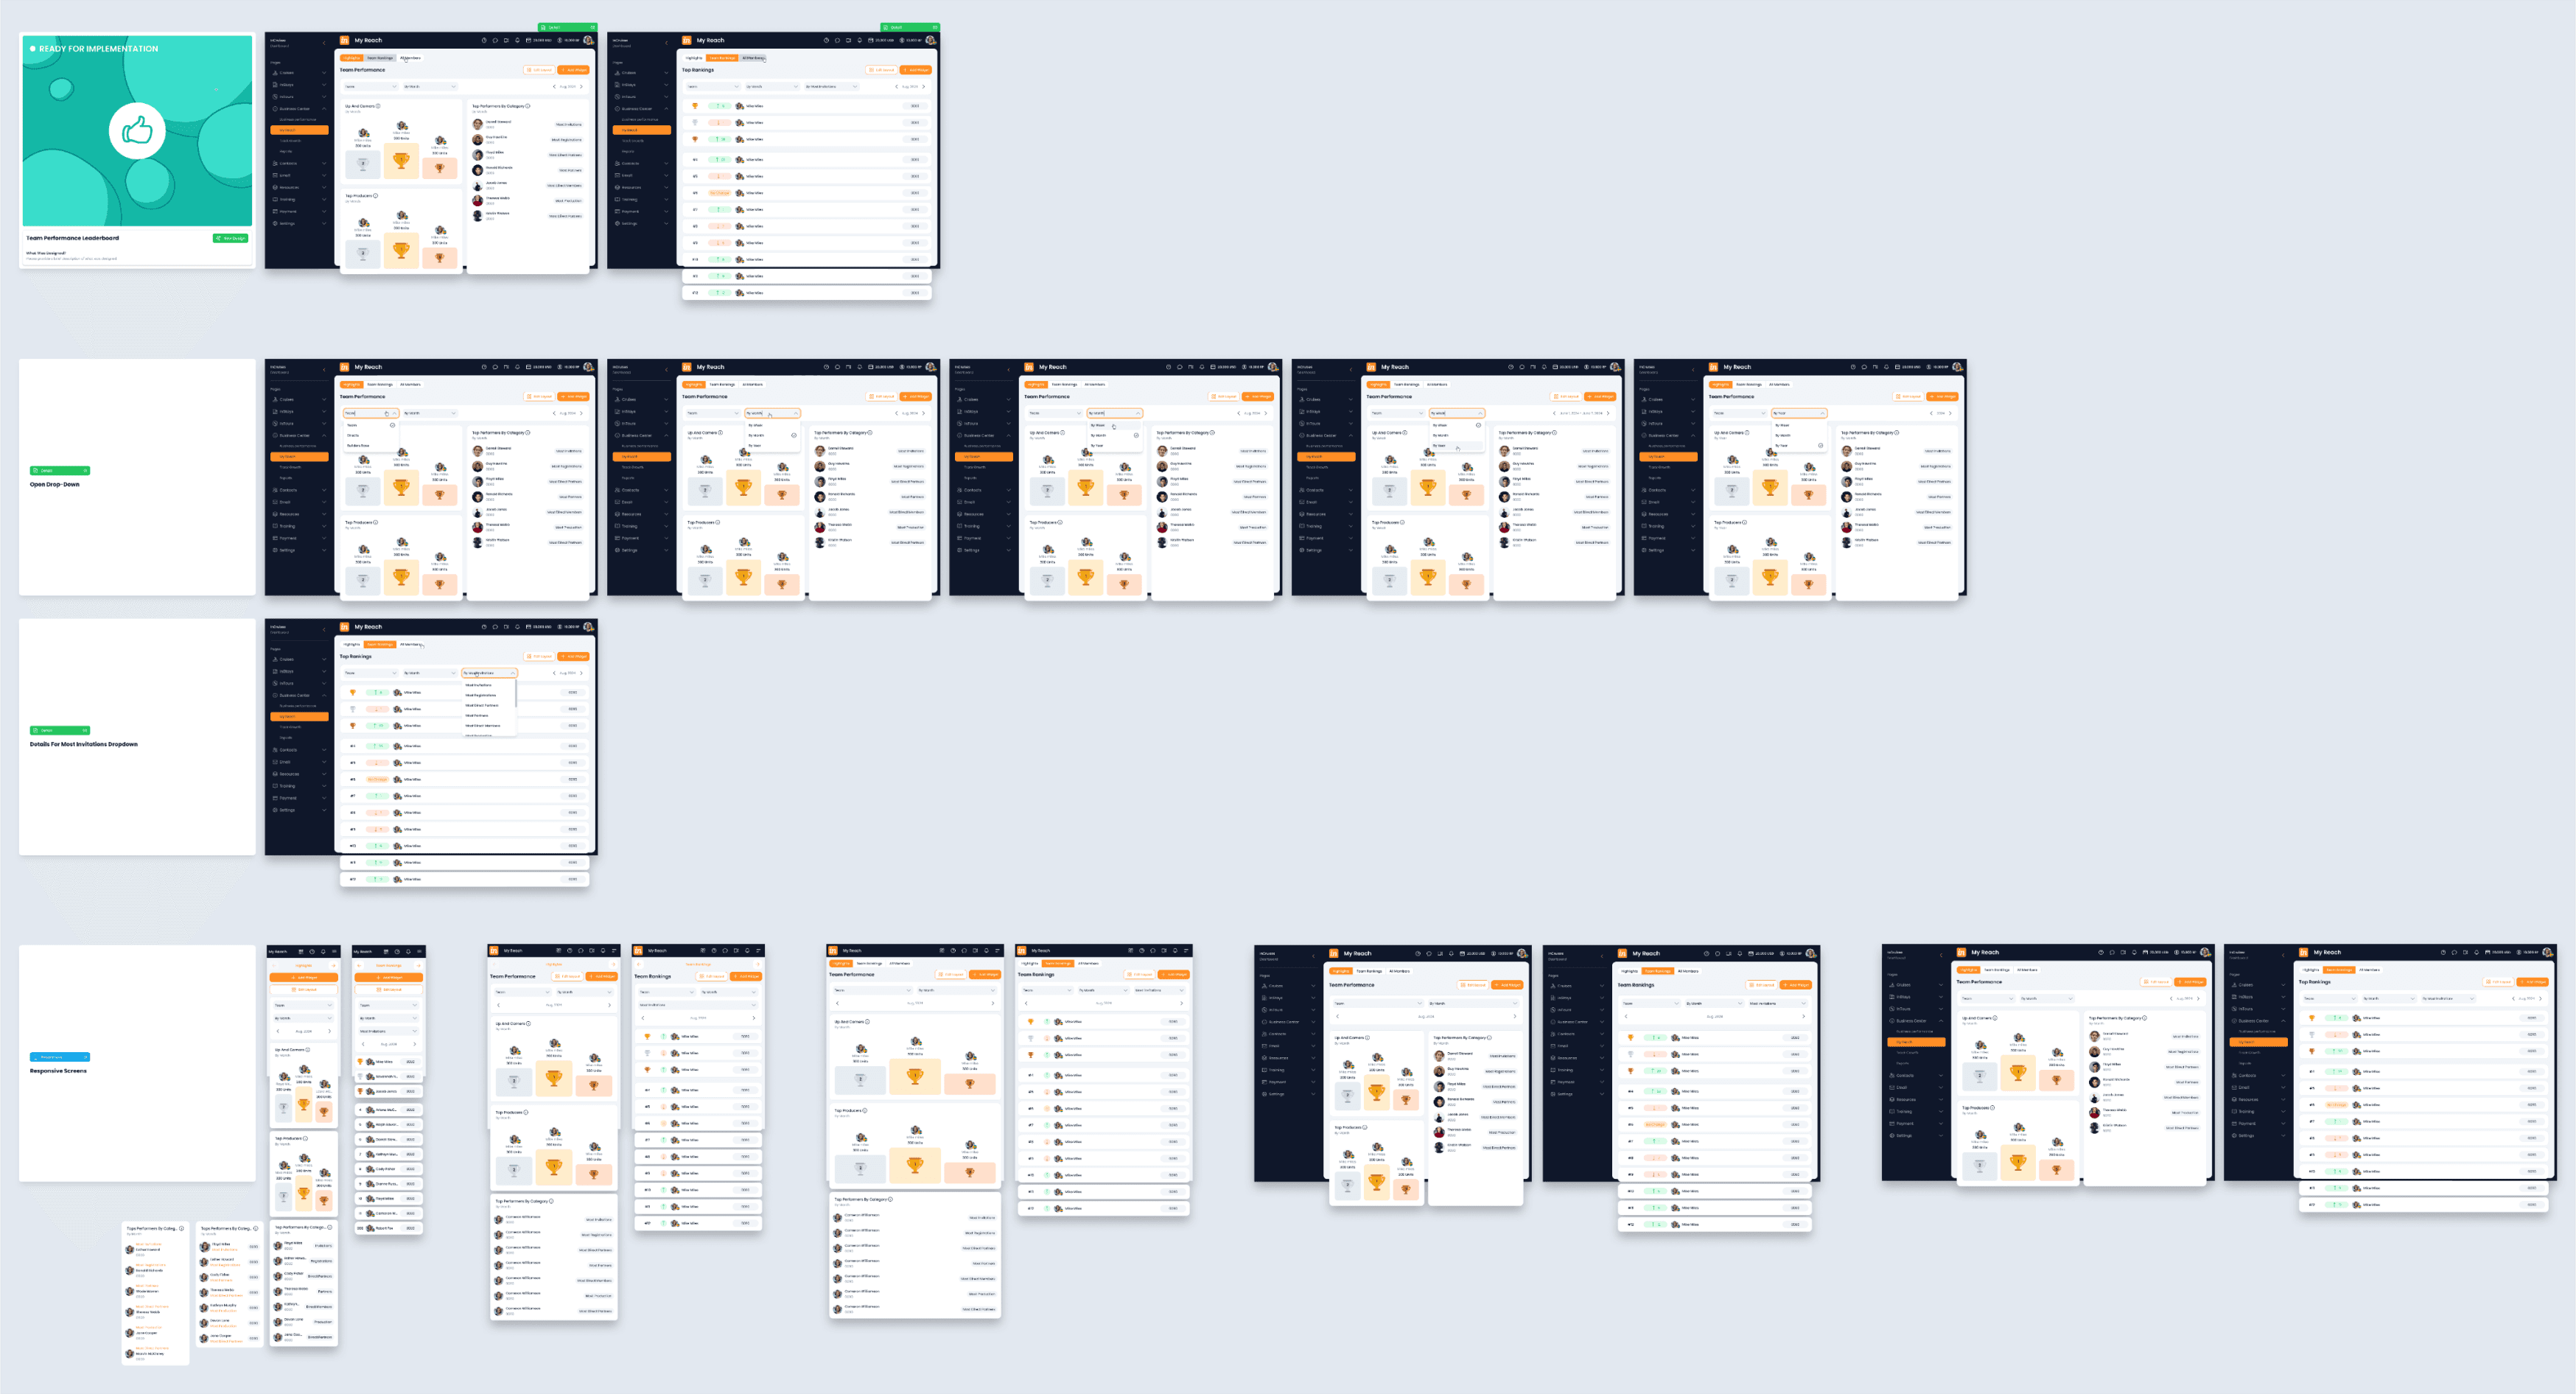
Figma file structure showcasing some of the final UI and responsive designs.
💡️ Project take aways
💡️ Project take aways
Creating modular and scalable widgets made it easier to display different types of performance data across screens, allowing for future flexibility and reuse
Creating modular and scalable widgets made it easier to display different types of performance data across screens, allowing for future flexibility and reuse
Reinforced the importance of intuitive navigation architecture in simplifying user workflows and improving overall efficiency
Reinforced the importance of intuitive navigation architecture in simplifying user workflows and improving overall efficiency


Planning exercise in Google Sheets outlining key milestones and expected outcomes.
Planning exercise in Google Sheets outlining key milestones and expected outcomes.
UXUI Design・Product Design
UXUI Design・Product Design
2024
2024